Performance Update: H1 2025
I also explain my 'Moneyball' approach to deep-value portfolio management.
Mr Deep-Value also offers:
Dirt-cheap access to Bloomberg’s No.1 competitor
Separately managed accounts for US clients
This update covers the first half of 2025, and I finally got around to posting it in August.
I know, I know.
Anyway, a lot has happened this year, but first, let’s start with the basics:
Performance since inception (Oct 23) = 47.05%
Performance YTD = 15.37%
The portfolio is around 80% invested and 20% cash.
And, now the details:
Highlights
There were three exits of note towards the beginning of the year.
First, we generated 100% return on a business called Good Energy.
As the name suggests, they specialise in ‘green’ energy (mostly solar) and were actually a growth stock disguised as a deep-value set up.
I was excited to hold this one and keep adding more as the price fell / remained low, but, alas, the low-price attracted a buyout and I had to settle with doubling my money instead.
The full Good Energy write up is here.
Next, we had Trivago. This was a stock that dropped significantly during our holding time.
At one point it was trading below its net-cash value, which I found truly absurd given what a huge brand it is, plus the fact it continued generating positive FCF the entire time.
Trivago yielded an average return of 75% in around a year.
The full write up for the Trivago investment is here.
Finally, we cashed out a business that was declining in value. Jerash Holdings is an interesting business.
They manufacture clothing for large brands like the North Face and Timberland. They have facilities in Jordan and take advantage of the cost differences.
Anyway, inflation was up, earnings were down and the stock was priced as if it was going out of business.
It definitely wasn’t, so I bought some.
The problem was, as each quarter went by, the balance sheet was declining and earnings were looking weaker and weaker.
The management team were also a bit sus, but not enough to put me off.
As a private buyer, the price I would pay for that business got dangerously close to my actual entry price.
I decided to exit the position for a small 5% gain, to recycle the capital into something with a bigger margin of safety.
You can read the full write up for Jerash Holdings up here.
Portfolio Action
Sometimes I look at the portfolio of stocks we hold and wonder if they will ever move.
Sure enough, however, things happen, catalysts arrive, and different stocks rise and fall like the tide.
Our Japanese stocks have, mostly, done pretty well this year.
We have 4 different stocks and a total allocation of 20% (to protect against currency risk etc), and 3 of them are up pretty nicely in the past year.
One is up 50%, the other 20% and the other 15%.
The fourth stock is down around 2%, and still hasn’t moved much, so far.
Japanese stocks are a quirky bunch. The entire Japanese market is littered with dirt cheap businesses.
The problem is that many of them seem to have been cheap forever. They never seem to attract catalysts, which is probably why they’re always undervalued.
I wrote about this weird phenomenon, and how I navigate it here.
I’ve actually been working on some deep-value software to help analyse stocks in more detail.
This has been a real eye opener because we can now see much more context for each business.
For example, we can now see the earnings consistency over decades and compare all major earnings types at a glance.
This has really helped us sift through the Japanese stock market in particular to pull out the little diamonds hiding amongst all the low-grade businesses.
This has already helped us identify several Japanese stocks that look much better, statistically, than the ones we have.
Moneyball
This is something akin to the ‘Moneyball’ approach.
The premise is simple: build a portfolio of dirt-cheap stocks that offers clear downside protection (low TBV Ratios etc), while also keeping it full of businesses that are cheap to earnings.
Then, replace each stock when a statistically better alternative is uncovered.
The goal is to run a portfolio with solid downside protection AND very low earnings ratios.
It’s not a secret that stock prices move with earnings, and this is why I strive to buy stocks that have decent earnings histories.
A reversion back to mean-earnings, usually triggers significant re-ratings in the stock price.
Companies with healthy earnings, also attract buyouts more frequently, which is another great catalyst for re-ratings.
This is much easier to find than companies that will grow their earnings in double digits over the next X years.
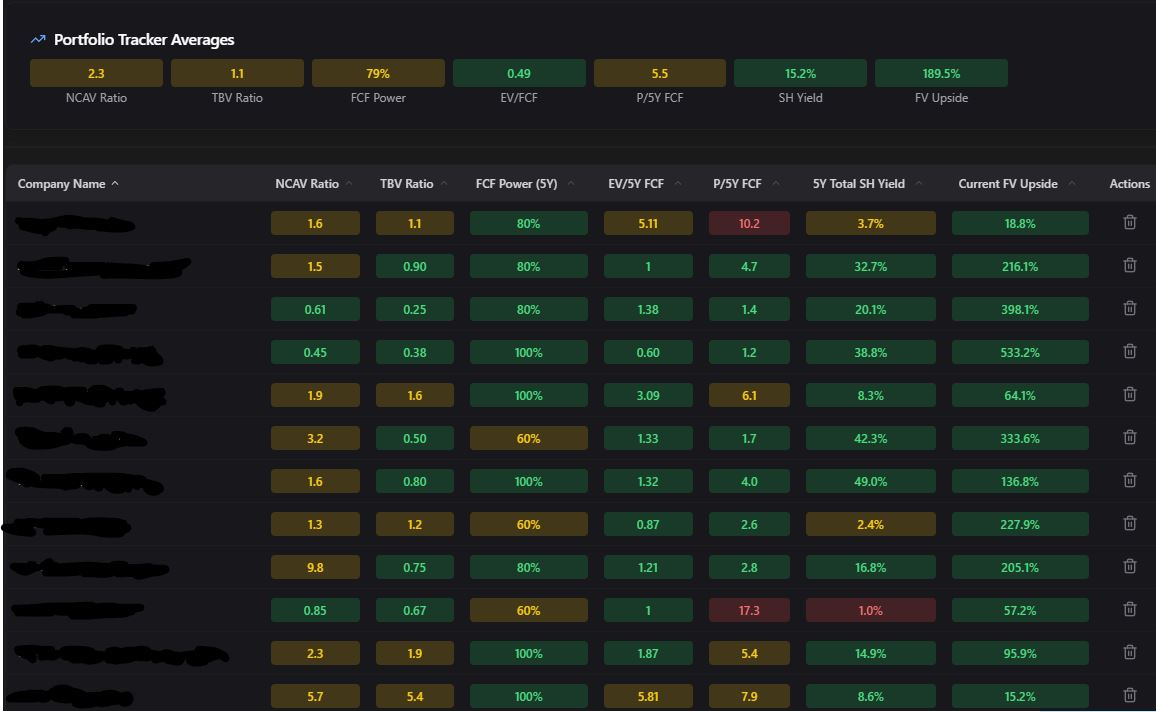
To illustrate, here is a snapshot of part of the current portfolio:
As you can see, each stock displays a ratio or score for how cheap it is, against assets and earnings.
I also rank the earnings quality (FCF Power 5Y), to show how consistent the earnings have been over time.
Then we generate an ‘average’ for the portfolio. This guides us when looking for new opportunities.
For example, The average TBV ratio would ideally be below 1, so that we have robust downside protection.
It’s currently 1.1, which is caused by stocks rallying and, occasionally, businesses deteriorating in value.
You can also see that some stocks are now not very cheap at all to earnings or assets, particularly P/5YFCF.
Those stocks also generally have lower upside potential to their fair value (as I calculate it).
These are the top candidates to be replaced whenever a better statistical opportunity is found.
Using The Data
This is helpful to the management of the portfolio in a few ways.
It’s important to note, that the reason I do this is simply that it provides a clear framework and structure to the approach.
Almost any scenario has a clear action based on this style of management.
When a beautiful opportunity is found, I don’t have to spend ages pondering which stock it should replace.
Or, if the market ‘crashes’, I can immediately see where to allocate more capital for optimal results.
It also helps me to avoid getting carried away and becoming too ‘earnings heavy’, which can gradually lead to a higher TBV ratio, and less margin of safety.
If you look at the portfolio averages above, you might notice that I need to try and focus on a couple of specific areas.
Firstly, we need to try and get the TBV ratio back below one (and as low as reasonably possible), to fortify the margin of safety.
Secondly, the general earnings ratio (P/5Y FCF) is creeping above 5. This is still low, but my goal is to keep this compressed as much as possible, for maximum re-rating potential.
Perhaps another thing that could be improved is the FCF power percentage. This is simply the percentage of years that the business has generated positive profits.
The goal, of course, is to get as close to 100% as possible.
Despite this statistical approach, every stock is also analysed for ‘qualitative’ factors. I assess things like management teams, strategy and likelihood of death.
I want businesses trading close to liquidation value that are, in fact, healthy, with no chance of actually liquidating.
Sometimes, I find businesses with management teams actually trying to grow and improve. These ones are cherished.
If they pass the ‘qualitative’ test, then they can go into the portfolio.
Coming Up
As you might expect, I also track a watchlist of potential investments in a similarly statistical manner.
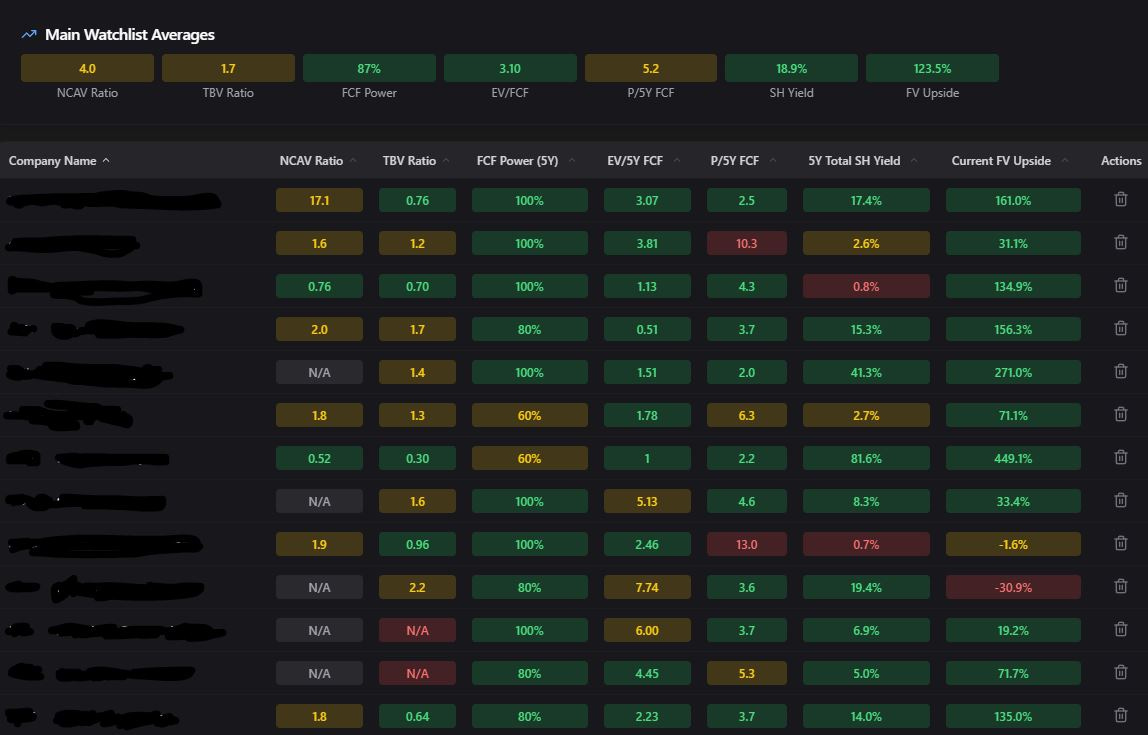
For example, here is a snapshot of some of my main watchlist:
The watchlist averages here are less useful.
Instead, we’re more interested in individual stocks that clearly beat the main portfolio averages or individual stocks within it.
These stocks are the ones that get the ‘qualitative’ research conducted first.
Sometimes, they are not as good as they seem.
For example, if the business is literally dead or they are genuinely in the process of liquidating, then I’m not interested.
But, sometimes, you find ones that are healthy and still FCF positive, but priced below liquidation value.
The only question we need to answer here is:
‘Will this business die or not?”
If the answer is ‘not’, then it’s highly likely it will revert back to its mean-earnings at some point, which will trigger a huge rally in the stock price.
You just have to patiently wait it out in the meantime.
Below is a classic example:
This stock is ridiculously cheap on every single valuation measurement.
It’s far superior to all the stocks we have in the portfolio, let alone our worst ones.
It’s a net-net with an earnings ratio of 1.
Remarkably, the business is STILL generating positive earnings, although they are lower than in recent years.
But still, far from dying.
Currently, we’re tracking a handful of stocks that have a similar profile. Once the old stocks have been fully cashed out of every portfolio, we will replace them with these.
This will then pull the portfolio averages back to where we like to see them, which makes the bar for getting into the portfolio even higher.
This creates a virtuous cycle of research and portfolio-refreshes, interspersed with patient waiting.
Most importantly, it helps us eliminate much of the guesswork from that process.
I personally believe that patience and consistency is probably more important in the long-run than ‘being a genius’.
The software we have built will helpfully continue to help us stick to our plan.
Mr Deep-Value also offers:
Dirt-cheap access to Bloomberg’s No.1 competitor
Separately managed accounts for US clients


Has this substack been sold to a new owner?