
A UK Listed Market-Leader for 0.9x TBV
Also includes hidden assets worth 50% of the current market cap.
Get a 90% discount off Bloomberg’s No.1 competitor. Get a 30-day free trial here
Today’s business looks cheap from multiple angles.
However, after looking a bit closer it seems like this is more of an asset-play more than anything else.
In other words, the earnings power is much worse in real-life, but the asset value seems to be much higher.
The first thing to say is that the business has just undergone a massive restructuring.
This renders all the recent averages and earnings figures pretty much useless for anyone trying to figure out how much the business is worth.
To get a more accurate figure we need to try and figure out the future earnings power.
(I’ll explain my calculation formulas later)
After doing this, we get the following ratios:
NCAV Ratio = 1.3
TBV Ratio = 0.9
EV/FCF Ratio = 18.0
P/FCF Ratio = 11.5
As you can see, the new operating business certainly isn’t cheap to a guy like me.
However, it is trading below the value of the tangible assets alone, which also indicates the operating business is essentially free.
If we factor in the ‘extra’ asset value, then the set-up becomes pretty compelling.
The shareholder yield is similarly misleading.
Using data from pre-restructuring years, it looks like we get a healthy 4.5% average yield. After accounting for SBC and dilution.
However, when we use the likely future FCF’s, with the same levels of SBC, the yield becomes more like 0.43% going forward.
Hence, the focus on assets.
It’s also worth noting that the enterprise value is significantly higher than the market cap, at $128m.
This is because I include capitalised lease costs as debt-like obligations. It’s what I’d do if I bought the whole thing for real.
Despite this, I still believe there is the potential for 50%-100% returns on this stock, once operations normalise over the next couple of years.
Let’s take a look…
The Business
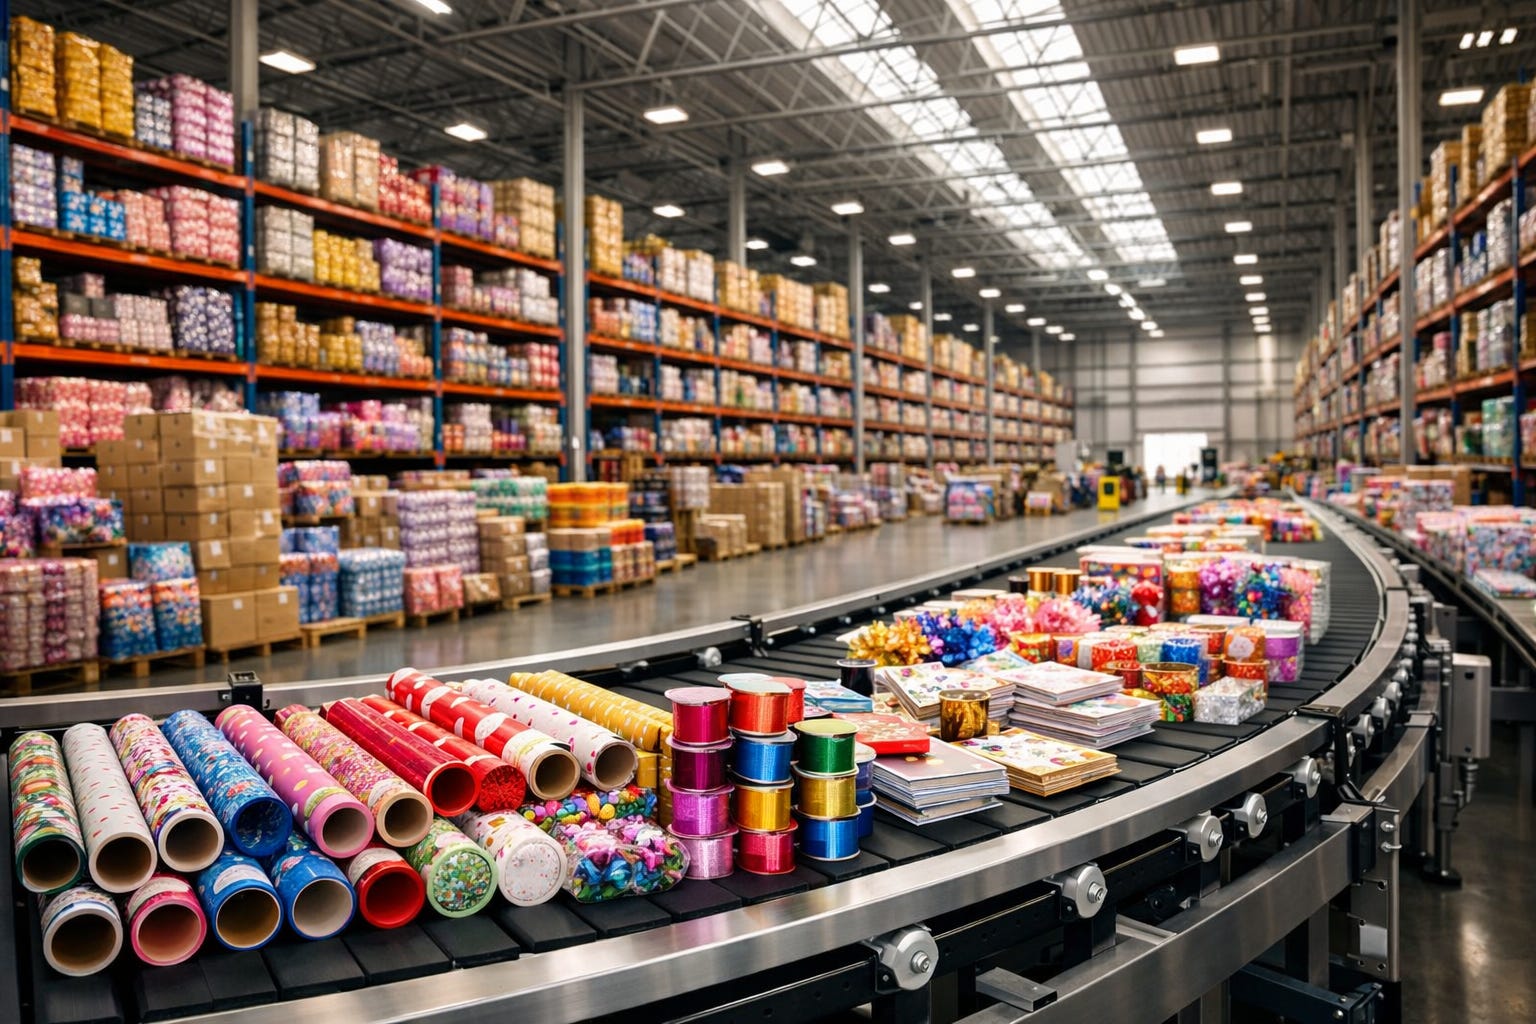
IG Design Group plc (IGR) is one of the world’s leading designers, innovators, manufacturers, and distributors of celebration and creative products.
Founded in 1979, the business is a massive one-stop-shop supplier to the global retail industry.
Following the disposal of its distressed American division in May 2025, the continuing business is now much simpler.
It operates exclusively across three core geographies:
DG Europe (45% of Group revenue): Designs, manufactures, and sources products with manufacturing hubs in the Netherlands and Poland.
DG UK (38% of Group revenue): Designs and manufactures products in Wales and Newport Pagnell, supported by a dedicated sourcing office in China.
DG Australia (17% of Group revenue): Operates primarily as a massive warehouse and distribution facility, sourcing all of its products with no in-country manufacturing.
The products sold fall into two key themes:
Celebrate makes up 64% of total revenue, encompassing items like gift packaging, greetings cards, gift bags, party products, and goods not for resale.
For example, if you buy generic gift wrap or paper party plates at a major supermarket, it is highly likely manufactured by IG Design Group.
Create makes up the remaining 36% of revenue, featuring products that encourage learning and creativity, such as craft products, stationery, and homewares like photo frames.
Sales are obviously highly seasonal.
Everyday products make up 50% of revenues, while the Christmas season dominates with 42%, leaving minor seasons (like Valentine’s Day or Mother’s Day) at 8%.
The company sells to over 4,340 customers globally, but its revenue is heavily skewed toward retail giants.
By channel, revenues break down as follows:
Value & Mass market retailers (70%), Independent retailers (16%), Specialist retailers (11%), and Online channels (3%).
Ownership is quite concentrated.
Alongside the Hedlund (founders) family’s 23.32% stake, institutional holders control roughly 47%.
Despite this, that institutional presence is the main reason I believe the delisting risk is very small.
The story of the last five years is a bit of a rollercoaster.
In 2020 and 2021, the company peaked following the massive acquisition of CSS Industries, aggressively expanding its US presence.
However, 2022 brought a perfect storm of problems.
Skyrocketing sea freight container costs, surging paper and polypropylene prices, and severe labour shortages crushed margins.
They went from 4.8% down to a disastrous 0.4%.
Because their generic products lack pricing power, they couldn’t pass these costs on fast enough.
From 2023 to 2024, a strict turnaround plan successfully recovered those margins to 3.9%.
But in 2025, the US market completely collapsed.
Subdued consumer demand, the Chapter 11 bankruptcy of their fourth-largest customer, and looming US tariffs turned the DG Americas division into a toxic liability.
The Board amputated this division, selling it to Hilco Capital for $1 in May 2025.
Today, management’s strategy is solely focused on sustainable organic growth, margin enhancement, and cash generation.
The metric they use to track this turnaround is the ‘Adjusted Operating Margin’, which they successfully recovered to 4.3% in HY2026.
The adjustments are mostly just stripping out things that are unusual and non-recurring.
Their medium-term target is 4% to 5%.
The Cash-Engine
The cash-generation engine of IG Design Group is highly predictable, but it relies on an extreme seasonal swing in working capital.
The cycle works like this:
From July to October, the business aggressively consumes cash.
It must buy paper, run its manufacturing plants, and build massive walls of inventory ahead of the peak Christmas selling season.
During this first half of the year, cash drains rapidly from the balance sheet.
From January to March, the engine reverses.
The Christmas products are shipped, massive retail customers are invoiced, and the working capital unwinds as trade receivables are converted back into cash.
To bridge this massive mid-year cash trough, the business relies on a £40 million Receivables Finance Facility.
As mentioned earlier, we can’t really use recent financials to value the operating business.
It is fundamentally smaller now.
For example, in 2022, revenues were over $965m.
Right now, management is targeting annual revenues of roughly $280m.
The average annual FCF over the last 5 years was roughly $30m.
To figure out what it will be going forward I used the formula below.
The reason I did it like this is because we only have ‘clean’ data for the new business for HY2026.
This is the most cash-draining period, and would provide a distorted picture of earnings power. This makes it difficult to annualise with any usefulness.
Basically, I stripped out the changes in working capital to try and come up with a smoothed (and more accurate FCF figure).
You might not agree, but here it is:
Step 1: Calculate Adjusted Operating Profit. Management has guided for an adjusted operating margin of 3% to 4% for FY2026.
Applying this to the 270m–280m revenue base yields an expected Adjusted Operating Profit of roughly $8m to $11m.
Step 2: Calculate Adjusted EBITDA. To find the operating cash flow before working capital movements, we must add back the non-cash stuff.
In the most recent half-year (HY2026), continuing operations recorded $2.5 million in standard depreciation and $2.1 million in right-of-use (lease) depreciation.
Annualising this suggests roughly $9 million to $10 million in non-cash add-backs.
Adding this to the operating profit gives an Adjusted EBITDA run-rate of roughly $18 million to $21 million.
Step 3: Deduct Capital Expenditure. The business must continually invest in its automated machinery and IT systems.
In HY2026, continuing capital expenditure was 2.4million. Annualising this requires deducting roughly $5m per year.
Step 4: Deduct Lease Principal Repayments. The business relies heavily on leased warehouse and manufacturing spaces.
In HY2026, the continuing Group paid $2.7m in lease liability principal re-payments. Annualising this requires deducting roughly $5.5m per year.
Step 5: Deduct Cash Taxes and Interest. The business relies on a receivables finance facility and must pay local taxes on its profitable European and Australian divisions.
In HY2026, the continuing Group paid $2.4m in cash taxes and incurred roughly 0.9m in gross interest costs (including lease interest).
I estimate a conservative full−year deduction of roughly $4m for these cash costs.
The Final FCF Figure: I just took the mid-point figures from all this and came up with a rough annual FCF figure for the remaining business of around $7m.
I tried to be accurate without being too ‘precise’.
Although this is still fairly speculative, I needed some idea of the future earnings power, to assess the valuation.
This is basically how I’d look at it if I was buying this business whole in the real-world, with my own hard earned cash.
The Assets
Today’s balance sheet is pristine compared to what it was a few years ago.
As mentioned earlier, it’s also where the main investment idea comes from.
I calculate the TBV as the money I could collect from an orderly liquidation of the business.
I estimate this to be less than the headline TBV ($120m), at $85m.
This is because the headline version includes right-of-use lease assets. I wouldn’t consider these an asset in a liquidation event, so I exclude them here.
The $85m figure is made up of fully-owned, liquid and hard assets that could be converted into cash.
However, we then come to those hidden assets I mentioned earlier.
Let’s start with the liquidation proceeds from the US division:
When the US division was amputated, it was sold to Hilco Capital for $1.
However, IG Design Group retained the right to 75% of any future net cash proceeds from the liquidation.
Because Hilco placed the entity into Chapter 11 bankruptcy, management conservatively values this earn-out at $0.
But let’s look at the actual hard assets handed over to the liquidator on 30 May 2025:
Cash: $10.6 million
Trade Receivables: $42.6 million
Inventory: $116.9 million
Total Liquid Assets: $170.1 million
Total Liabilities: ($104.5 million)
Net-Assets = $65.6m
Even in an orderly liquidation, these receivables, from major US retailers, should be highly collectible.
Even with haircuts and discounts, IG’s 75% could be worth around $10m.
Next, we have the property portfolio:
The company owns freehold real estate carried on the books at historical cost minus depreciation, totalling $16.5m.
Recent real-world sales prove this is dramatically understated.
A Kansas property with a book value of $2.2 million sold for $6.7 million.
A Pennsylvania facility carried at $2.9m sold for $8.4m.
This seems to imply there is a healthy gap between the owned properties and the real-world value of them in today’s market.
This suggests that the true market value of the remaining properties ($16.5m book value) is something closer to $50m.
This is another $30m (ish) in hidden value, not included on the balance sheet.
Together with the liquidation proceeds, this equals around $40m in hidden value.
This means we get an additional margin of safety that is equivalent to 50% of that market cap ($80m).
This offers some very nice downside protection, while we wait for the operating business to stabilise over the next few months.
Why It’s Cheap
The recent saga is probably the main reason.
Revenues have been slashed, earnings figures crushed and terrifying headlines about failed acquisitions and toxic subsidiaries have scared everyone away.
They also suspended dividends, which is never a good look when the stock price is already under pressure.
Management is well aware of all this.
During the 2022 audit, management concluded the market capitalisation was not a representative valuation of the group’s intrinsic value.
In response, management even directed the Employee Benefit Trust to purchase 2 million shares in the open market.
The goal was to prevent massive dilution from granting stock options at such thoroughly depressed prices.
However, all this pessimism is now already priced in.
The Risks
The clean up has already happened and most of the bad stuff is now gone.
The stock price has been obliterated, and expectations for the future of the business are pretty low.
The management team have also cleared away almost all of the bank debts, although they do have considerable lease obligations.
Aside from the business going under thanks to general risks or problems that any business in this industry could suffer, I don’t see much left to worry about.
The only thing I did notice was a small note about an off-balance sheet ‘guarantee’ made by IG design group, to the US division for its lease payments.
The reports don’t quantify this, so it’s probably worth digging into further if you like this idea.
It doesn’t appear to be anything that could materially impact the going-concern nature of IG, but I haven’t really looked at it beyond what’s in the reports.
The Investment Case
This set-up is simple.
For $128m (EV) we’re getting a business with revenues of almost $300m and FCF of (probably) $7m per year.
We’re also getting a global brand that dominates the markets it operates in.
And we’re not paying for any of it.
The current market cap is priced below my conservatively adjusted TBV, even without the additional $40m from the US liquidation and property values.
We’re paying for the assets, at a discount, and getting a pretty solid operating business for free.
I believe that even the slightest positive report from the operating business over the next 1-2 years, will cause the stock to re-rate at least 50% (possibly more).
With all the hard work done, the team is now focused on the resumption of normal operations, which is going well.
The next updates will be after the major holiday period, which in turn should see a massive influx of cash, making the business appear even more stable and attractive.
The current price at the time of publication is £0.57.
My target would be around £0.90.
If you’d like to see the exact stocks I own, you can do so with an annual subscription.
The annual plan also includes access to bonus content which you can learn more about here.
If you like these ideas and what to access the bonus content along with the 20% discount, grab your annual plan below.
Get a 90% discount off Bloomberg’s No.1 competitor. Get a 30-day free trial here
How do you get to an EV of $128m? The market cap is $75m. Net cash as year end is $70m
Re book value ignore intangible assets and that knock $15m off the NAV
Right of use assets and lease liabilities balance each other
So the NAV is $123m + US recovery if any.