
Deep-Value Screener
Searching for cheap stocks can be laborious.
After constructing my initial portfolio, using free screeners, a big-buttoned calculator, and a pen and paper, I decided to build a spreadsheet.
(I wrote about how I got started in deep-value, here).
The goal was to allow me to type in a ticker and instantly display the key valuation metrics that any conservative deep-value investor would want to see.
I’m talking NCAV Ratio, TBV Ratio, EV/E Ratio, P/E Ratio and Shareholder Yield.
I wanted to turn more rocks over, quicker.
The sheet worked well, but I was hungry for more.
More context and visibility into each businesses financials and more speed and efficiency to help me find more ideas.
So, I decided to build my own software.
Here it is:
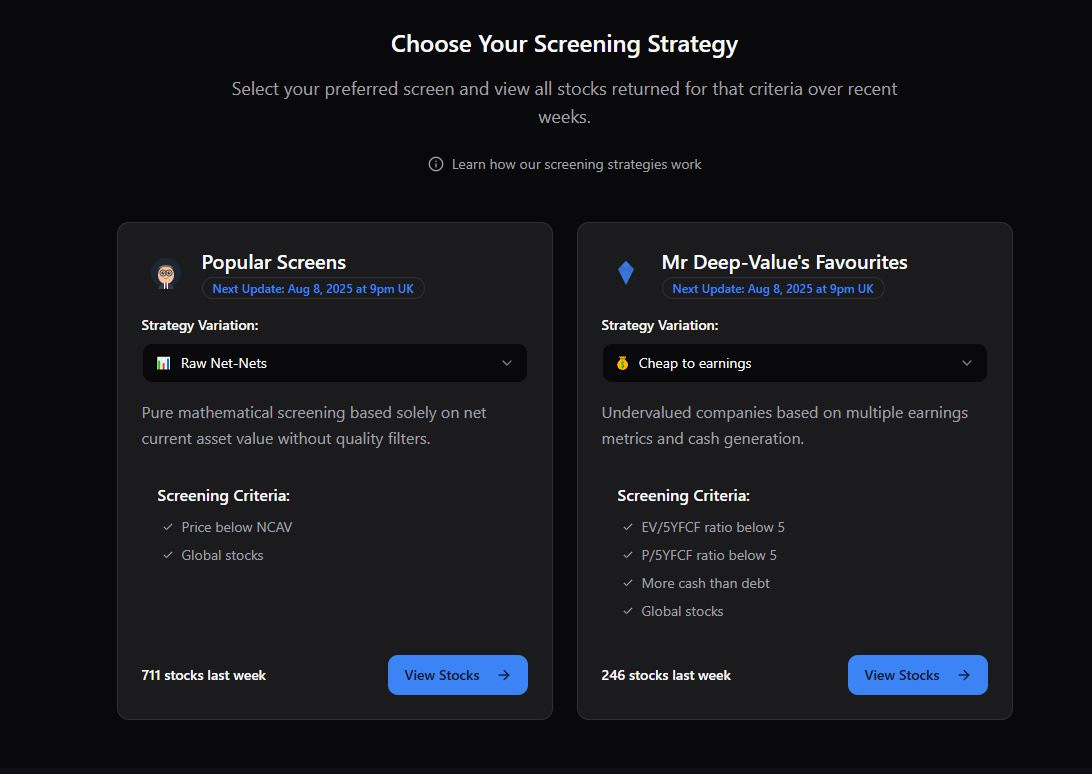
This lets me select the specific type of screen I want to search for and pull in all stocks from around the world that match the criteria.
This solves a few problems:
First, it allows us to specify quality over quantity. For example, our ‘classic net-nets’ screen includes the original criteria for positive earnings.
This almost automatically excludes most of the cash-burning freakshows that typically fall into the net-net bucket.
Secondly, it helps us search multiple criteria in an organised manner. We can neatly process all stocks from a specific screen before moving to the next batch.
Once we can screen for a vast variety of deep-value stocks, the next problem is analysing them.
Here’s our valuation tool:
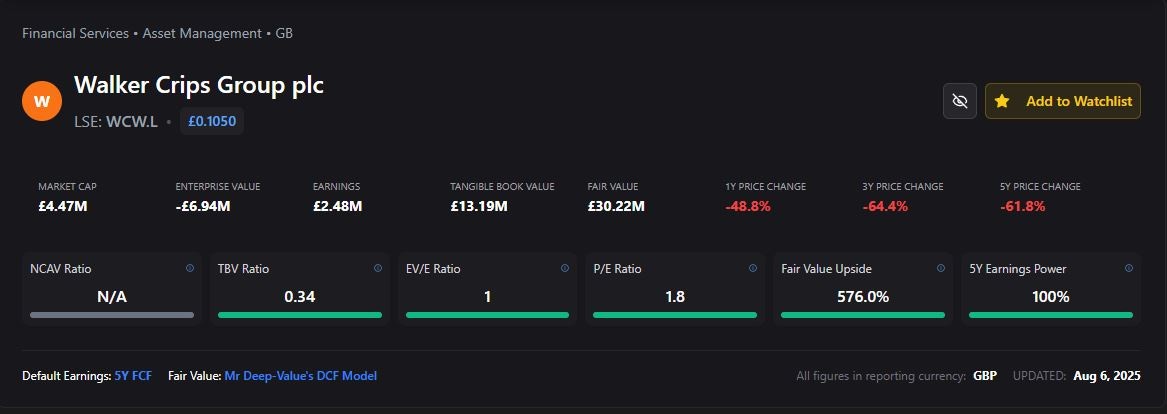
When a ticker is typed into the search bar, it instantly generates a quick-view of the key deep-value metrics.
This helps us quickly see whether the stock is cheap to assets, earnings or both.
Next, we created an overview section:
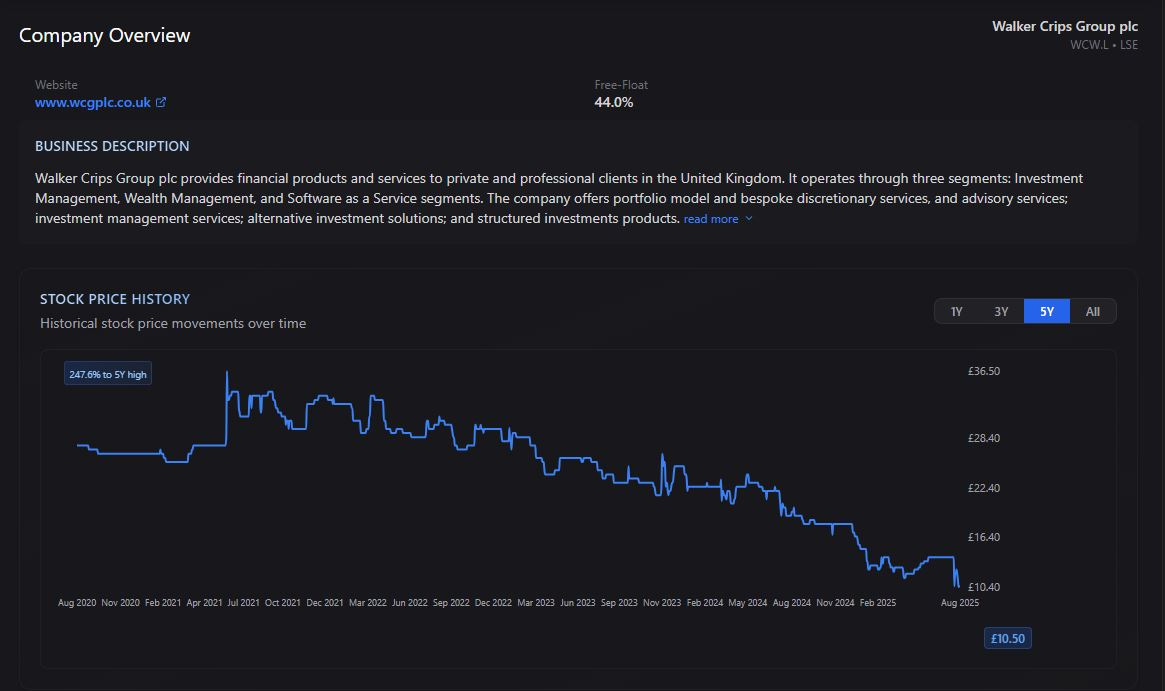
This helps us see if the price fell significantly, or if the stock is just constantly cheap. I wrote about the importance of this here.
This also shows the free-float percentage, which is key to deciding how feasible and activist position could be.
Next up, we created the price to value history display:
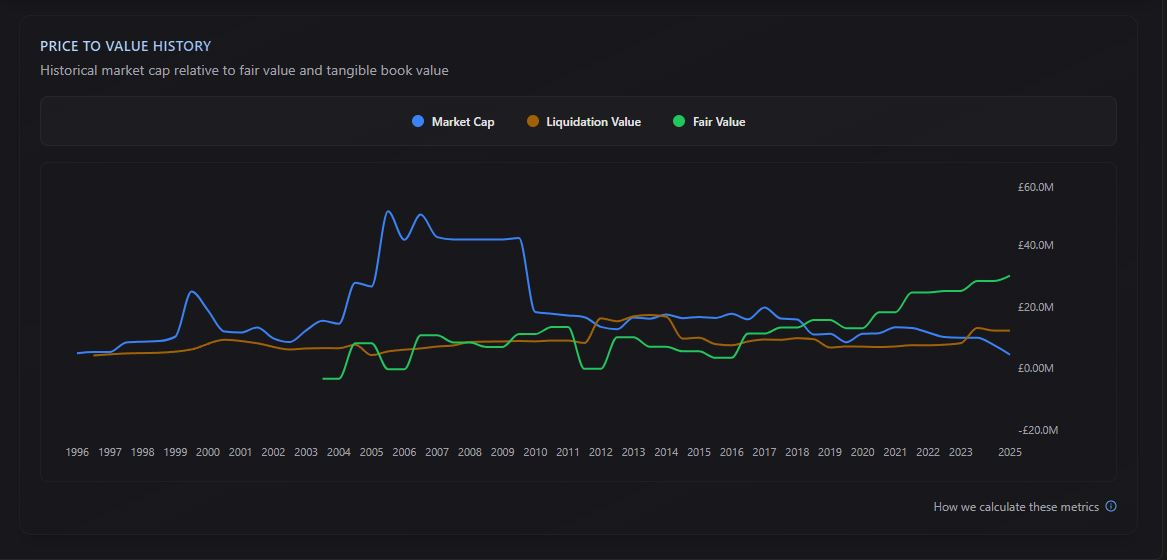
The goal of this is to show how the intrinsic value (as we calculate it) has fluctuated over time in comparison to the actual market cap and liquidation values.
We get excited when the market cap price drops below one or both of these valuations, from prior highs. This can often signal a mispricing.
Next, we want to see the quality of earnings, over a long period of time (20 years if possible).
Here’s how we visualise this:
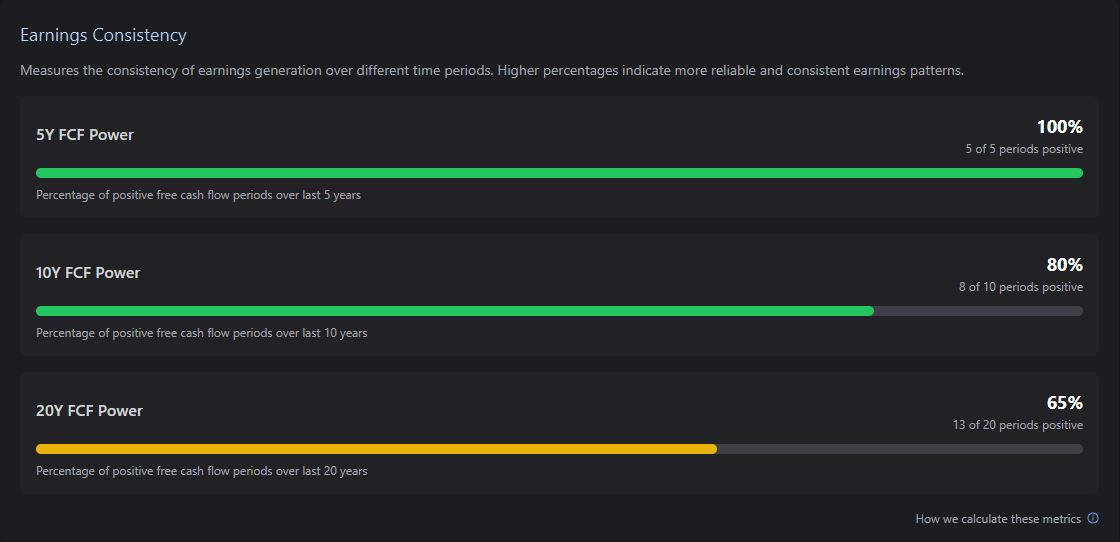
I prefer to view FCF rather than net-income.
This shows me how consistent the earnings have been over each time period. The perfect stock is on that has strong, consistent earnings across all periods.
This is key, because it indicates the business will continue on, while the stock price indicates it will die imminently.
This mismatch gives us confidence in a mispricing having occurred.
Next, we want to get a full view of earnings over a long period of time, to uncover any accounting shenanigans or other concerns.
We do this through our historical earnings comparison display:
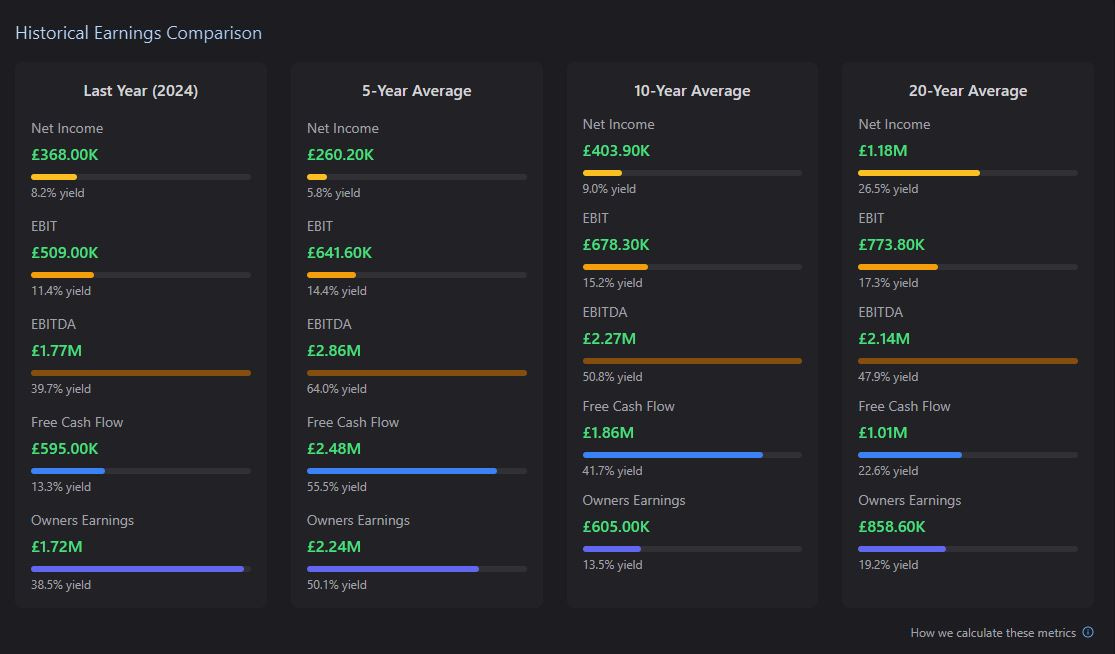
The beauty of this feature is that it quickly allows us to see any weird fluctuations or variations in earnings types.
For example, if FCF is significantly higher than the rest, it could signal that there are non-business cash balances being included in the FCF figure.
Or, if net-income is significantly higher than the rest, it could signal that the company is somehow inflating profits to try and fool investors.
The ideal scenario is that they all converge around a very similar value over time.
In deep-value, reversion to the mean is a huge concept. In business, things usually go back to ‘normal’ overt time.
This is especially true for things like revenue and earnings or mediocre businesses that no one has heard of.
One display we note often is the earnings volatility:
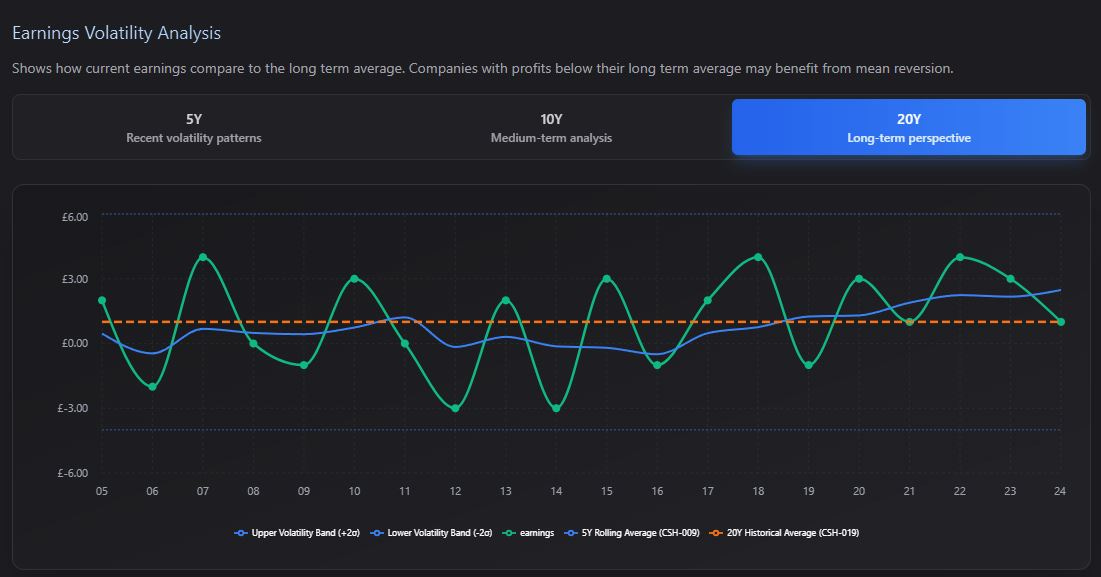
This shows us where current earnings are, in relation to the 20Y average and the rolling 5Y average.
When earnings drop below these levels, it’s usually a sign that a reversion could be on the way.
The obvious exception to this is a business that is dying or in structural decline (which is why we also look at the other metrics above).
Once we have a handle on earnings, our next focus is on assets:
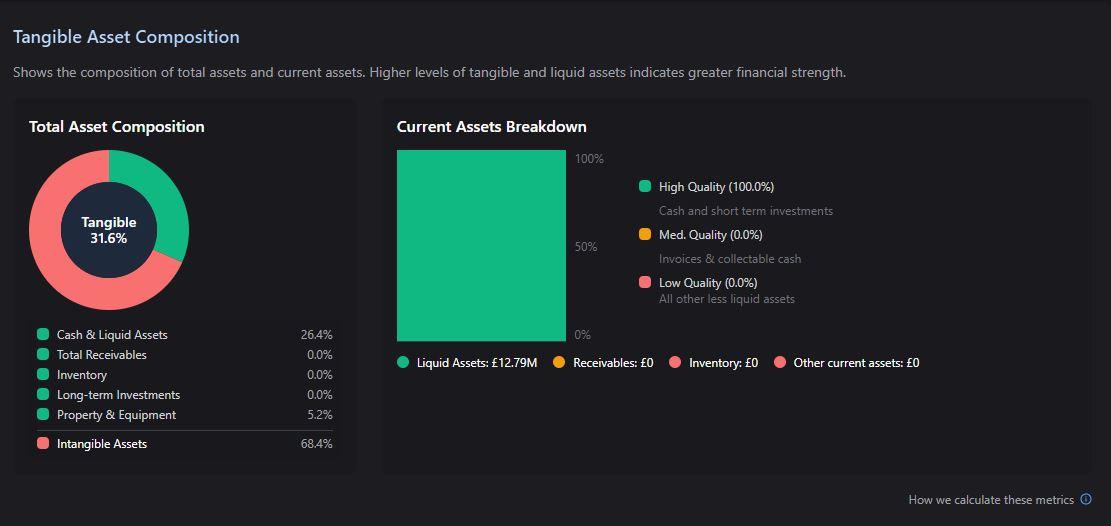
Tangible assets and high quality current assets are the focus here. I personally, prefer cash-heavy businesses, as they are easier to value conservatively.
As you can see above, our software displays the breakdown of tangible assets and also the composition of current assets.
This helps us determine the financial health of the business.
Another view, is to look at the cash-health of the company more directly:
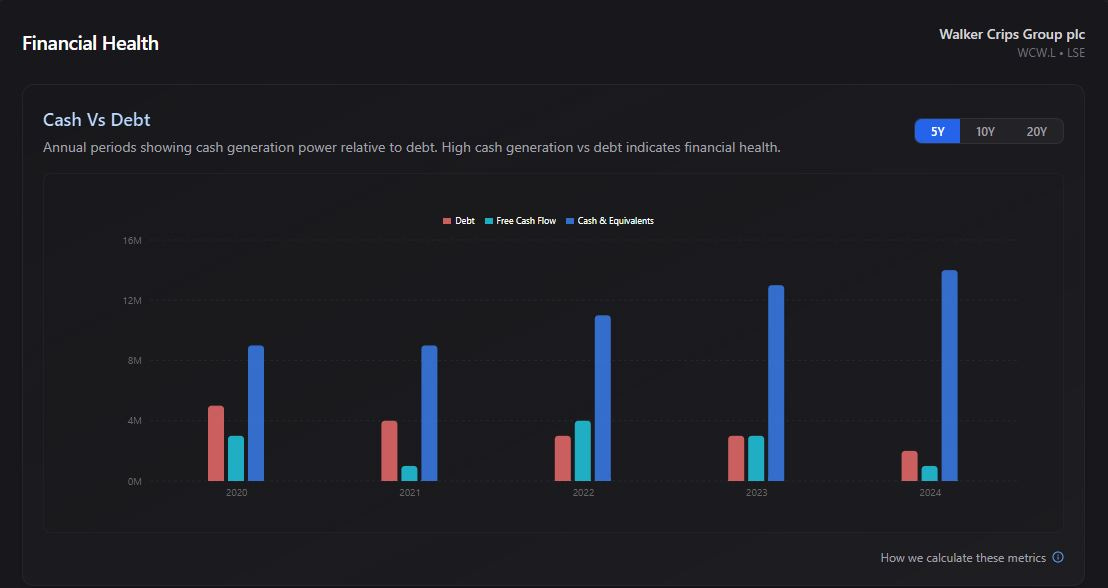
This view, compares total cash & liquid assets with total debt and free cash flow for each period.
Our goal is to find businesses that are financially sound with almost zero chance of becoming insolvent any time soon.
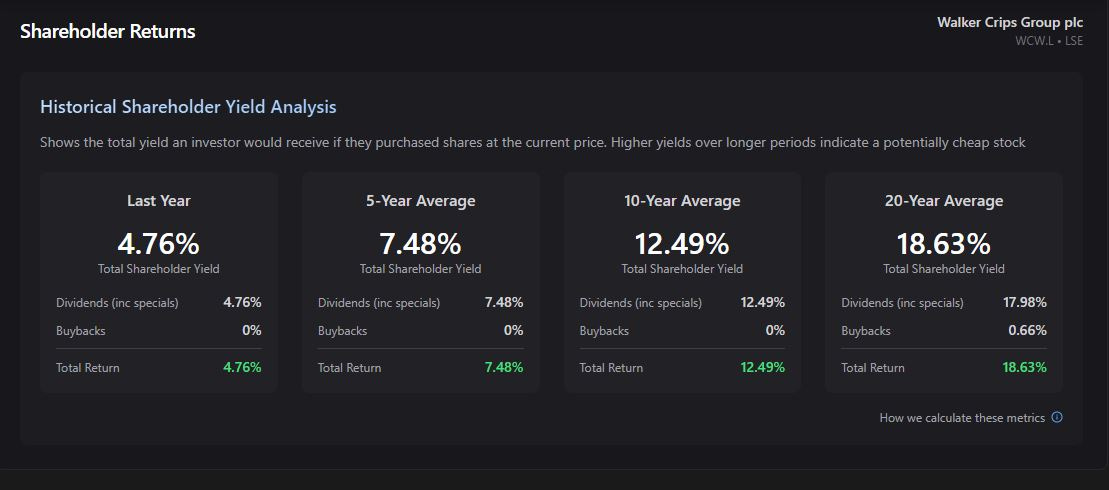
Another metric we find useful is the average shareholder returns, over the long-term.
This shows what our yield would be if we received historical dividends (we also count buybacks) at todays market cap.
I very high yield can often indicate that a business has become mispriced by the market.
Higher dividends and buybacks also adds an extra safety net in case an external catalyst fails to materialise.
These often cause prices to rerate higher, when they’re delivered.
Our shareholder yield display is here:
All of these views, help us to understand the health and stability of a business.
Deep-value stocks are often priced as if their future earnings are worth nothing (I.e they will never generate profit again).
Our job is to satisfy ourselves that this is nonsense and that the business is robust enough to get back to its long term averages in the next couple of years.
When we find stocks that are dirt-cheap AND healthy, we get excited and start to figure out if the stock is better than what we already have and how we can integrate it.
If you’re interested in using our software, please click the button below to join our waiting list.
If enough people show an interest we will release it as a product.